- 表格制作快速入门:对编辑公式功能的改进Part 2
- excel数据分析:组合Excel数据透视表内的日期项
- excel入门教程:使用Excel组合框控件制作调查问卷
- excel表格制作:Excel双层饼图
图表四:PowerPoint和Word中的图表
One thing we know is that many of the charts that folks created in Excel end up in PowerPoint presentations or Word documents (I think the statistic is that 50% of all charts in PowerPoint presentations originate from Excel. While users work in Excel to analyze their data, the final results are often given to others, and they rarely want to include all the intermediate steps from Excel. Furthermore, users have all kinds of solutions to transfer their charts. Most just use copy and paste, but some use Excel’s copy as picture command, or write VBA solutions, to update their charts in various ways. In Office 2007, our goal was to make copying and pasting charts into PowerPoint and Word as easy as possible. We also wanted the resulting charts to be as easy to use in PowerPoint and Word as they are in Excel, and we wanted to address a lot of problematic behaviours that existed in current versions of Office when you moved charts from Excel to PowerPoint one way or another. Today I am going to briefly review the work that we did in this area.
我们知道有很多图表是在Excel中创建,然后在PowerPoint或 Word中使用(我觉得PowerPoint中大约有50%的图表是来自Excel的)。当用户使用Excel进行数据分析时,最后的报表往往不包含中间步骤,而是将最终结果交给别人。 此外,用户还会使用各种各样的方式传递图表。最多的就是使用拷贝和粘贴,也有些用户会用Excel的“复制为图片”命令,或写VBA解决方案,以各种方式来更新图表。在Office 2007中, 我们的目标是使复制并粘贴图表到PowerPoint 和Word中易如反掌。我们也希望此图表在PowerPoint 和Word中的使用与在Excel中一样方便。在当前Office版本中,当你用某种方式移动Excel图表到PowerPoint中时,我们要解决很多问题。今天我想简单地回顾一下这方面的内容。
Charts as OfficeArt Shapes
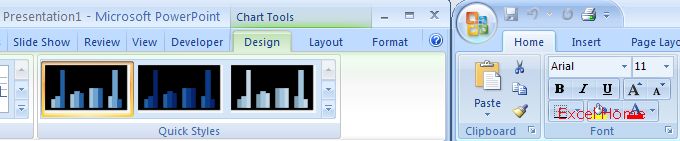
At the core of all the improvements we have made in this area, charts in PowerPoint 2007 and Word 2007 are just like charts in Excel 2007. They are native objects in PowerPoint and Word, just like they are in Excel, and as a result, the user experience and behaviour is pretty much identical in all three applications. They have the same themes, chart types, layouts, and styles that were discussed in the last article. They even have almost the identical ribbons and dialogs as Excel 2007. Here is a screenshot of charting in Word 2007 in a near-beta-2 build. You can see how this is identical to what we looked at in Excel 2007 last week.
我们在这方面改进的核心是:在PowerPoint 2007和Word 2007中使用图表有如在Excel中使用图表。在PowerPoint和Word中图表是默认对象,就像在Excel中一样。在三种不同的应用程序中其制作方法和过程基本相同,他们有同样的源数据,图表类型,布局和风格,也有与Excel 2007几乎相同的Ribbon和对话框。 这是一张Word 2007 beta-2的图表截图, 你可以看到这与我们上一篇里Excel 2007图表是多么相似。

(Click to enlarge)
The chart’s default theme will come from the presentation or document, just as it does from the spreadsheet’s theme in Excel. This ensures that your charts will match the rest of your document, whichever of the three applications you are using.
For Office developers, the entire chart object model from Excel is now available for charts in Word and PowerPoint too. With a few modifications, it’s possible to migrate solutions that used the Microsoft Graph object model over to the new charts, although you can keep using Graph should you not want to migrate your code.
图表的默认源数据将来自幻灯片或文档,就象Excel中源数据来自工作表一样。 这保证你的图表与文档相符合, 你用三个应用程序中的无论哪一个进行Office开发,整个Excel图表对象模型现在也可在Word和PowerPoint中应用。会有一些修改,新的图表移植解决方案中会使用微软的图表对象模型,虽然可以继续使用图表,但是不能移植代码。
Data for Charts
图表数据
There is one big difference, of course, between charts in Excel and charts in Word and PowerPoint – Word and PowerPoint don’t have a grid for the data. The solution to that in Office 2007 is to use Excel for the chart data in all three applications. When you create a chart in PowerPoint, PowerPoint and Excel tile side by side. You can type the data in Excel, and watch the chart update in PowerPoint. Better still, you can use the full power of Excel for all charts, including formulas, connections to external data sources, and sorting & filtering. When you are done entering the data, you can close Excel, and PowerPoint will return to full size. In this case, the Excel spreadsheet containing your data is embedded in your PowerPoint document in case you need to edit it later.
在Excel中作图与在Word 和PowerPoint中作图有一个很大的不同:Word 和PowerPoint没有数据表格。在Office 2007中解决这个问题的办法是在这三个应用程序中都使用Excel表格作为数据源。当你在PowerPoint中创建图表时Excel和PowerPoint的标题栏会并列显示。 你可以在Excel中输入数据,在PowerPoint中观看图表的更新。 更好的是,你可以充分利用Excel的所有功能来表现图表,包括公式、连接外部数据源,排序和筛选。当你输完数据,你可以关闭Excel,PowerPoint将恢复实际大小。在这种情况下,包含了数据的Excel表格是内嵌在PowerPoint中的,以后如果需要可以随时进行修改。
上一篇:表格制作快速入门:快速比较不同Excel区域的数值(一) 下一篇:表格制作快速入门:数据透视表IV――任务向导用户界面,或“为我们
郑重声明:本文版权归原作者所有,转载文章仅为传播更多信息之目的,如作者信息标记有误,请第一时间联系我们修改或删除,多谢。