- 用VBA修改Excel的程序界面(二)
- excel入门教程:Excel服务VI――用Excel Web Services创建应用程
- excel vba教程:透视不规则数据源
- excel宏教程:在Excel中实现图片自动更新
Tables Part 1: Working With Tables Of Data
列表(第一部分):处理列表中的数据
(译者注:本文中的“列表”其原文为“Table”,在已经发布的Excel中有一项功能称为“模拟运算表”【在数据菜单中】,在其相应当英文版本中也是“Table”,本人认为本文讨论的Excel 12新功能不同于现在的模拟运算表,所以使用“列表”一词,在最终发布的Excel 12中文版本中所使用的名称可能与本文不同,特此说明。)
For the next few posts, I’d like to spend some time explaining the work we’ve done in Excel 12 to improve the experience of working with tabular data in Excel.
接下来几章中,我将花一些时间来解释一下Excel 12如何改善对于表格化数据(译者注:原文中的Tabular Data)的处理。
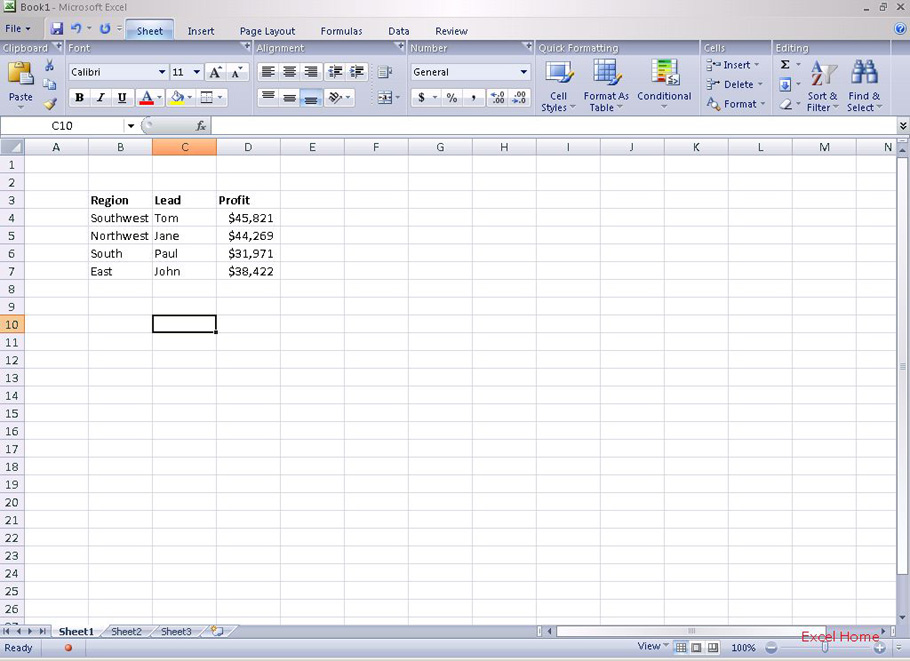
One thing that we see pretty much every Excel user doing with some frequency is working with tables. Tables can mean different things to different people so let me briefly define what we think of when we use the word table. A table is a simple structure where each row corresponds to a single “thing“ (e.g. a specific transaction, an individual product, etc.), and each column denotes a specific piece of information that’s shared by all rows (e.g. amount of each transaction, product quantity, etc.). Tables typically have a “header“ row at the top that defines the information that each column contains. Some examples of tables might be a list of financial transactions or the latest inventory numbers pulled from a server. Here’s an example of a very simple (and fictitious) table.
我相信每一个Excel的用户都会非常频繁的用到表格。在不同场合“表格”这个词有很多种含义,让我先来简单的定义一下我们所说的列表,列表是指一个简单的结构,列表的行对应于一个单一“项目”(例如:一个交易,一种产品等等),列表的列表示每个项目的某些具体信息(例如:每项交易的金额,产品数量等等)。典型的列表拥有标题行,一般位于列表的第一行,它用来定义每列所包含的内容,列表也可以是交易清单或者从服务器上得到的最新的库存数量。这里有一个非常简单的列表。
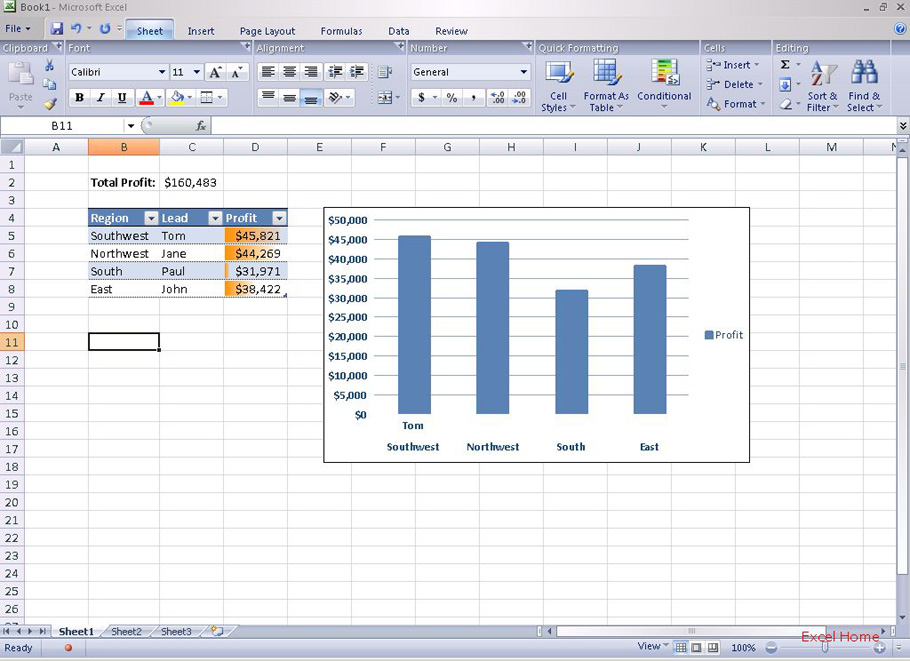
The two-dimensional nature of the spreadsheet makes it an obvious canvas for manipulating and analyzing tabular data. Excel, however, has traditionally offered very little in the way of features aimed at tabular data because it had no built-in knowledge of what a table is or how it should behave. We’ve done a lot of work to make tables a native structure in Excel 12. When Excel knows you are working with a tabular structure, it can react much more intelligently to the actions you perform in the grid. Let me demonstrate by way of a simple example. Here is what our table might look like if we formatted the table, applied a data bar to the Profit column, added a chart, and added a formula at the top of the sheet that totals the Profit column.
支持二维数据存储的电子数据表格可以很容易的处理和分析表格化数据,然而传统的Excel只能提供很少的处理表格化数据的功能,究其原因在于Excel并没有内置关于列表的相关内容,如列表是什么样子的,如何操作列表。我们做了很多工作,使列表完全的融入Excel 12。对比以前在列表中进行数据操作,在新版本中,一旦Excel认为用户在使用列表,那么它将提供更智能化的反应,让我们用一个简单的例子解释一下,下面是我们格式化后的列表,对于“Profit”列使用Data Bars(译者注:如希望更多的了解Data Bars请参考本版面的帖子“条件格式概览——Data bars”),添加一个图表并且在列表上方添加一个公式用于计算“Profit”列数据的总和。
The next thing I might typically do is add some more data. Let’s look at what happens when I type a value just below the table in cell D9.
接下来添加数据,我仅在D9单元格输入一个数值,我们看一下工作表有什么变化。
After I pressed Enter, several things happened for me automatically:
在我按下<Enter>键之后,工作表自动作出了如下的反应:
1. The value that I entered was consumed into the table. Excel assumed I was appending data to my table (if I wasn’t, one click will tell Excel to not auto-expand the table)
2. When the table consumed the data, my table formatting automatically extended to the new row – and notice that it was smart enough to maintain my alternating row colors
3. The conditional formatting data bar also extended to the new row, so Excel is now using D5:D9 to calculate the relative size of the data bars
4. The formula at the top updated itself to include the new data
5. Finally, the chart updated as well to reflect the addition to our table
1. 我输入的数据加入列表中,Excel假设我在向列表追加数据 (如果用户不需要这个结果,只需要点击一下告知Excel不需要自动扩大列表)
2. 当新数据融入列表时,我的列表格式自动扩展到新的数据所在行,请注意这项功能非常智能的延续了原来列表的间隔行颜色格式
3. 条件格式的数据条同样扩展到新的数据行,Excel将用D5:D9的数据重新计算Data Bars的大小
4. 求和公式自动更新,结果将包含新添加的数据
5. 最后,图表同时更新反映出列表中添加的数据
上一篇:表格制作excel教程:XII 筛选OLAP数据,以及一些“持续”改进(二) 下一篇:excel函数公式大全:奇妙的自定义数字格式(一)
郑重声明:本文版权归原作者所有,转载文章仅为传播更多信息之目的,如作者信息标记有误,请第一时间联系我们修改或删除,多谢。